2020 Water Quality Report Card is Here
In celebration of the 50th anniversary of Earth Day on April 22nd, Blue Water Baltimore held our second annual Afternoon With Your Waterkeeper event to release our 2019 water quality data. In response to current global events, we took the event online and held our very first large-scale webinar!
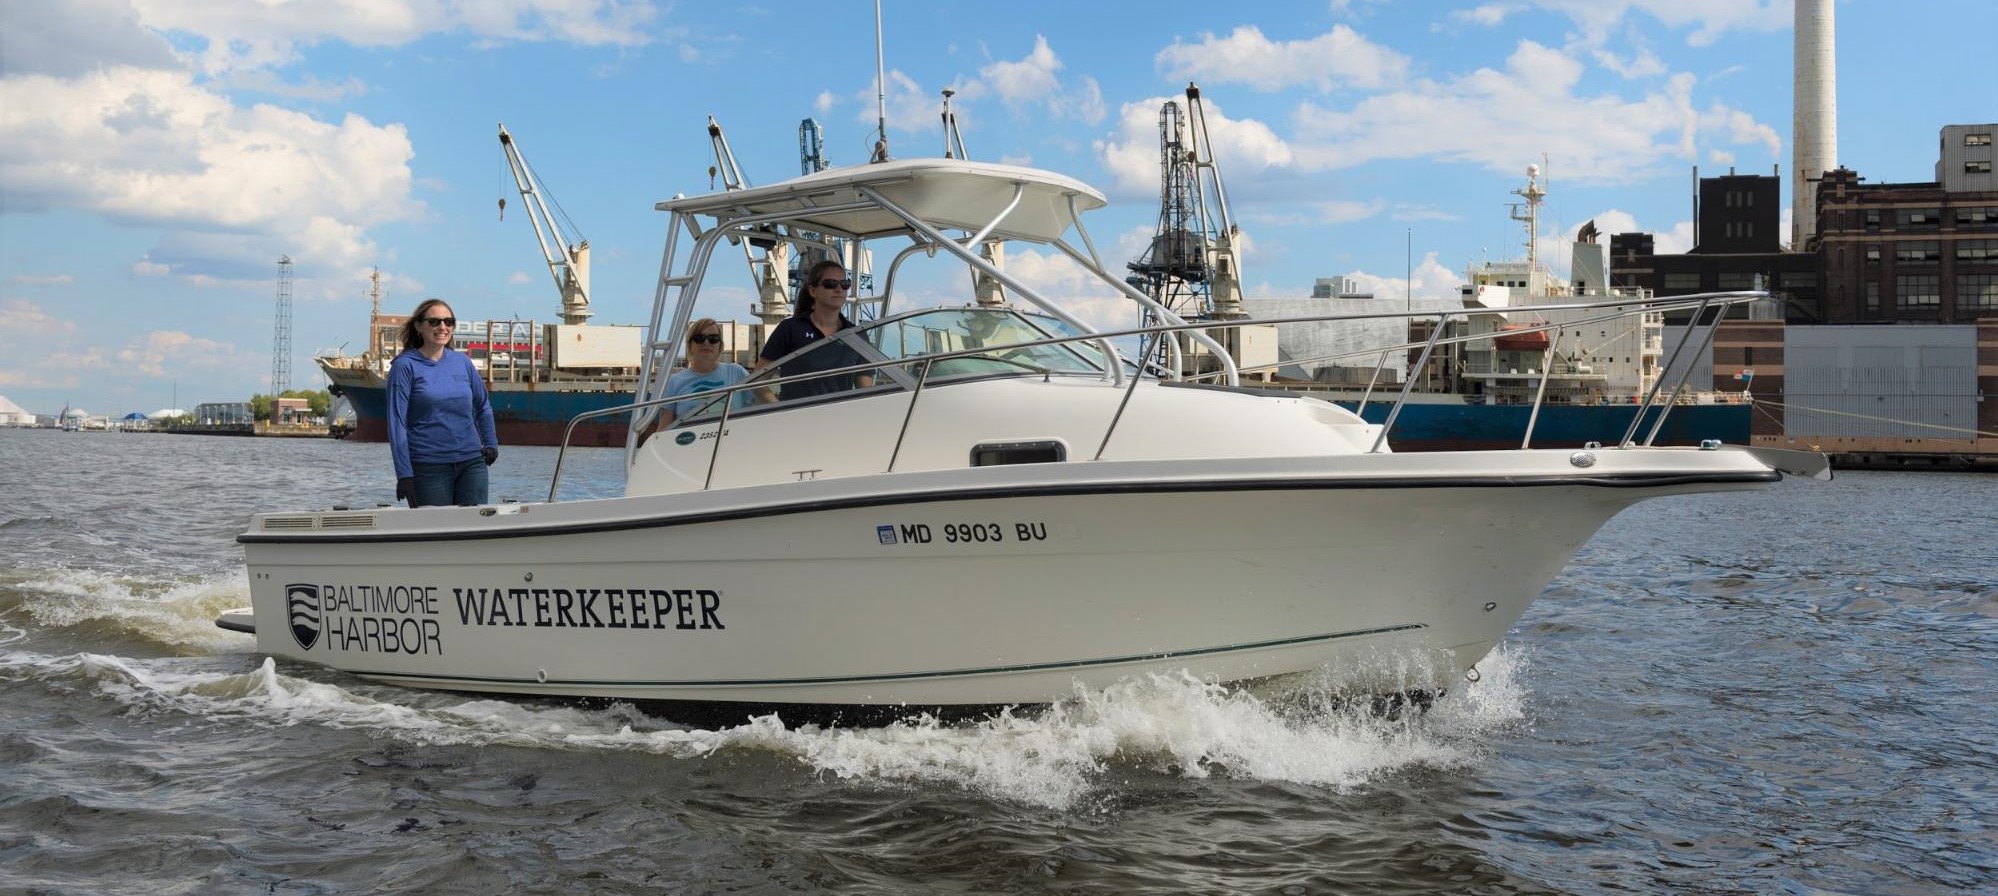
Our water quality monitoring program hit an important milestone this year, as 2019 marks our 10th year of collecting bacteria data in the Baltimore Harbor. Over the years Blue Water Baltimore’s monitoring program has expanded under the direction of your Baltimore Harbor Waterkeeper, and we have been collecting a full suite of scientifically rigorous water quality data in our local streams, rivers, and Harbor since 2013.
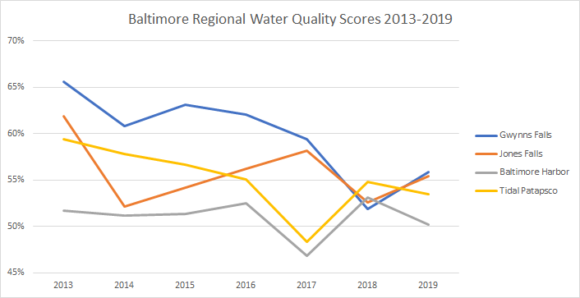
Our report card scores the health of Baltimore’s waterways and aims to answer an important question: ‘How’s the water, hon?” This year, we continue to see poor marks for the Gwynns Falls watershed (56%), the Jones Falls watershed (55%), the Baltimore Harbor (50%), and the tidal Patapsco River (53%). Water health scores are determined by collecting many different measurements such as water clarity, temperature, oxygen content, and more throughout the year. Individual parameters are scored according to a scientific protocol, and the 2019 data is then rolled up to determine an annual score of water health for each of our 49 stations (out of 100 possible points). The regional scores you see below are determined by averaging the scores of several different stations within each watershed.
Here is a summary of the findings from our 2019 data :
- A primary driving factor for the consistently low scores in our nontidal waterways is very poor conductivity. Conductivity is a measurement of the salts and chemicals in our streams that could harm fish and other organisms. Road salts, sediment, polluted stormwater runoff, and sewage overflows contribute to poor conductivity levels.
- In 2019, we saw more typical rainfall than in 2018 (38” vs 72”). We saw the impacts in our 2019 data:
- Water Clarity scores improved at almost every single station, both tidal and nontidal.
- Phosphorus scores generally improved as well, which is not unusual, because Phosphorus binds to the sediment particles in stormwater runoff (more rain = more runoff = more sediment in streams).
- Unfortunately, in 2019 tidal Chlorophyll levels largely returned to their typically-poor levels, reversing one of the few positives we saw in our data in 2018.
- Some of the impacts to our waterways have been physical rather than chemical. We can no longer safely access two of our monitoring stations due to excessive amounts of sediments filling in access points, likely from the 2018 storms: the nontidal Patapsco outlet and Cox Creek.
- Again, it’s a mixed bag and water quality scores vary significantly from station to station. The best way to see all the data is online at www.BaltimoreWaterWatch.org/report-card.
Among other factors, the continued poor health of Baltimore’s local waterways is largely the result of stormwater and sewage pollution. Each year, hundreds of millions of gallons of stormwater and sewage pour excessive amounts of nutrients, sediment, and fecal bacteria into our streams and Harbor.
But it’s not all bad news. We are excited to announce that for the first time ever, Blue Water Baltimore has collected enough data to conduct a trends analysis on each water quality parameter for the 7-10 years for which we have data at our 49 sites. Our analysis showed the following statistically significant trends:
- The Big News: There are significantly improving trends in bacteria at 34 of our 49 monitoring stations.
- This is great news!!
- While we do not know exactly WHY bacteria is improving, these trends could indicate that sewer replacement and relining projects are working to reduce the amount of sewage flowing into our waterways.
- Most of the bacteria improvements were seen in our streams during dry weather. This could indicate that illegal sewer connections and leaky pipes have been discovered and fixed by both Baltimore City DPW and Baltimore County DEPS/DPW.
- Three stations showed significantly improving bacteria trends during wet weather. While we are only seeing this trend at 3 stations, they are 3 of our most degraded stations: Gwynns Run, the Inner Harbor at the Jones Falls Outlet, and the Inner Harbor near the Downtown Sailing Center.
- This is extremely encouraging news because it appears the locations most affected by sewage overflows are showing signs of improvement.
- We do not know if these data are linked with specific projects in the ground, but we believe the message here is clear: We must prioritize sewer rehab project investments because they are working to measurably improve water quality.
- Bacteria is just one aspect of water quality. While these trends are great news, it’s important to remember that many stations showing improving bacteria are still too polluted to support recreation much of the time. The fact that these sites are showing significantly improving trends means we are moving in the right direction, but we have more work to do.
- Bacteria is simply too variable to be able to make blanket statements about whether or not it’s safe to recreate, which is why state and local authorities rely on individual readings to determine what recommendations to make.
- There are some significantly worsening trends at many stream stations, perhaps indicating we are not doing enough to reduce polluted stormwater runoff.
-
- Nitrogen, Phosphorus, Water Clarity, and Conductivity are worsening at roughly half of our nontidal stations.
- For example: the Powder Mill Run, which flows into the Gwynns Falls stream and crosses between the City-County line, is in rough shape. Water quality is steadily getting worse here for many indicators – nitrogen, phosphorus, and turbidity levels are all getting worse. And while bacteria is not getting worse, it’s also not improving.
- We’re also seeing worsening nitrogen trends at 11 of our 13 stations in the Jones Falls watershed. For example, our station just below Lake Roland is displaying worsening nitrogen over time, and is one of only 3 stream sites not showing dry-weather bacteria improvements (the others are Powder Mill Run and one of our lowest mainstem Gwynns Falls stations).
- We desperately need to reduce the amount of polluted stormwater runoff that is STILL degrading the health of Baltimore’s streams. This means installing more green stormwater infrastructure projects and increasing funding from our City Stormwater Utility Fee for these kinds of projects. What we’re doing now isn’t working. As we saw from the 2016 Gwynns Falls Trends Analysis study and the most recent IPCC report, our region is expected to receive more intense storms with more total precipitation as climate continues to change. We must act now in a major course correction if we want to see lasting improvements in ecological health.
Taken in total, these results tell us two things:
- Projects undertaken by the City and County to improve our old leaky sewer infrastructure seem to be working. While we can not necessarily link bacteria improvements to specific projects, we are hopeful that this data trend indicates real progress associated with sewer improvements.
- However, we are missing the mark in our regional approach to stormwater. Our current practices aren’t keeping pace with climate change, a growing suburban population, and increased development. Our data suggests we have to dramatically increase funding and attention to meaningful stormwater management that reduces stormwater volumes and treats stormwater before it enters our waterways. Many regions have found success using green stormwater infrastructure projects, like trees and rain gardens, to better manage stormwater, while also greening neighborhoods. .
As a science-based advocacy organization, Blue Water Baltimore’s work is guided by strong data. Our data shows that our waterways are often still too polluted for many fish and wildlife to thrive, or for recreational activities to occur. There is still so much work to be done before ecological health can be restored. But recovery is possible, and we know the steps we need to take to get there. Ultimately this is the sign of hope Baltimore needs right now.
You can view the full presentation here and please share with others.
____________________________
Alice Volpitta is the Baltimore Harbor Waterkeeper at Blue Water Baltimore. She’s passionate about using science to advocate for Baltimore’s waterways and hold polluters accountable. To learn more, visit www.bluewaterbaltimore.org/waterkeeper.
Featured image credit: Damon Meledones.