Over the past fifteen years, Blue Water Baltimore’s water quality monitoring program has grown from a handful of bacteria samples in the Baltimore Harbor to a full suite of water-health parameters at 51 stations in the waterways throughout the Baltimore region. In that time, our staff and volunteers have collected over 193,000 individual data points that paint a very clear picture: Baltimore’s streams and rivers need your help.
Our water quality scores are calculated according to UMCES’ Mid-Atlantic Tributary Assessment Coalition protocol, and each station is scored from 0-100% on the following factors: chlorophyll, conductivity, dissolved oxygen, water clarity, and total nitrogen and phosphorus. The higher the score, the healthier the waterway.
We also collect readings for “Vital Indicators” of water health including pH, temperature, and fecal bacteria. While these metrics are critical for ecological and public health, they are not included in the overall score. The underlying data is always available for free to the public at www.BaltimoreWaterWatch.org.
Use the toggle bar at the bottom of the map to scroll through parameters.
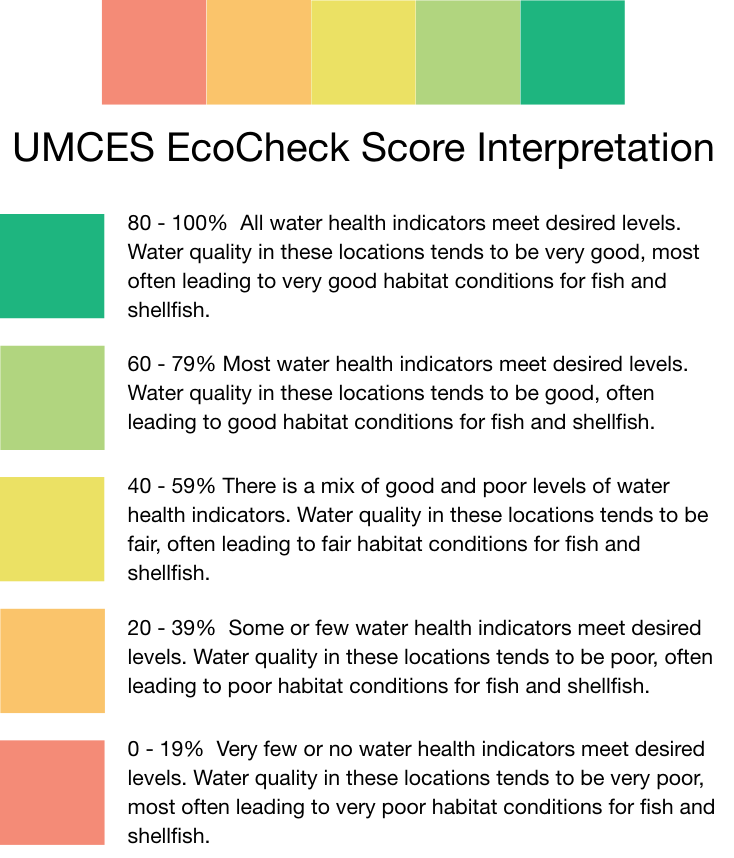
What Do The Scores Mean?
Since the beginning, Blue Water Baltimore has always prioritized accuracy, clarity, precision, and transparency in all aspects of our water quality monitoring program. That’s why we follow strict sampling procedures and protocols outlined in our Quality Assurance Project Plans, and it’s why we make our data free and available to the public for download at www.BaltimoreWaterWatch.org. We take measurements of many different components of water health over the course of a sampling season, and then we use numeric benchmarks or “assessment threshold values” established by the University of Maryland Center for Environmental Science (UMCES) to determine what those readings actually mean in context. The scoring protocol that we follow is called EcoCheck, and it was developed by the UMCES Mid-Atlantic Tributary Assessment Coalition (MTAC) in 2011. The EcoCheck system uses a quintile scale for data interpretation, which means that the percentage scores from 0 – 100% are equally divided into 5 scoring “sections.” This is different from the traditional grading scale that we are used to seeing in an academic setting, where anything below 60% is considered an “F”.
From 2014 – 2024 Blue Water Baltimore used academic scoring to communicate about water health in our region, which aligns with peoples’ intuitive understanding of what an “A” or “F” grade equates to on a percentage scale. This year, we are realigning our scores with the EcoCheck scale without assigning letter grades. This allows us to accurately communicate about water health just like we always have, while eliminating any confusion about the academic vs quintile grading systems. All of BWB’s data from 2009 – 2024 is comparable because the percentage scoring system we use has remained consistent over time. The EcoCheck interpretation for each percentage score quintile band is shown at right, and available in the MTAC manuals online. (Tidal manual and Non-Tidal manual)
Why Are the Colors Different in Print and Online?
When The Commons first built our innovative data mapping platform in 2014 (originally known as HarborAlert.org), we were able to display the results of our robust water quality monitoring program like never before. We utilized the site to assess whether our streams and rivers were achieving regulatory standards outlined in the Code of Maryland Regulations (COMAR), and the capabilities of the platform grew significantly over time. Now, www.BaltimoreWaterWatch.org is a cutting-edge data visualization tool that helps people understand how healthy or sick our local waterways are, and what metrics of water health are driving overall scores. When the map was built, it was hard-coded to display scores using colors associated with the academic grading scale. The scores you see in the digital report card are exactly the same as what you’ll see in the printed report; the colors assigned to the quintile bands are the only difference. As we work to refine our communications about the water quality data we collect, some aspects of data visualization such as colors and icons used are likely to be modified over time. But the data and scores remain consistent, no matter what.
How’s the Water, Hon?
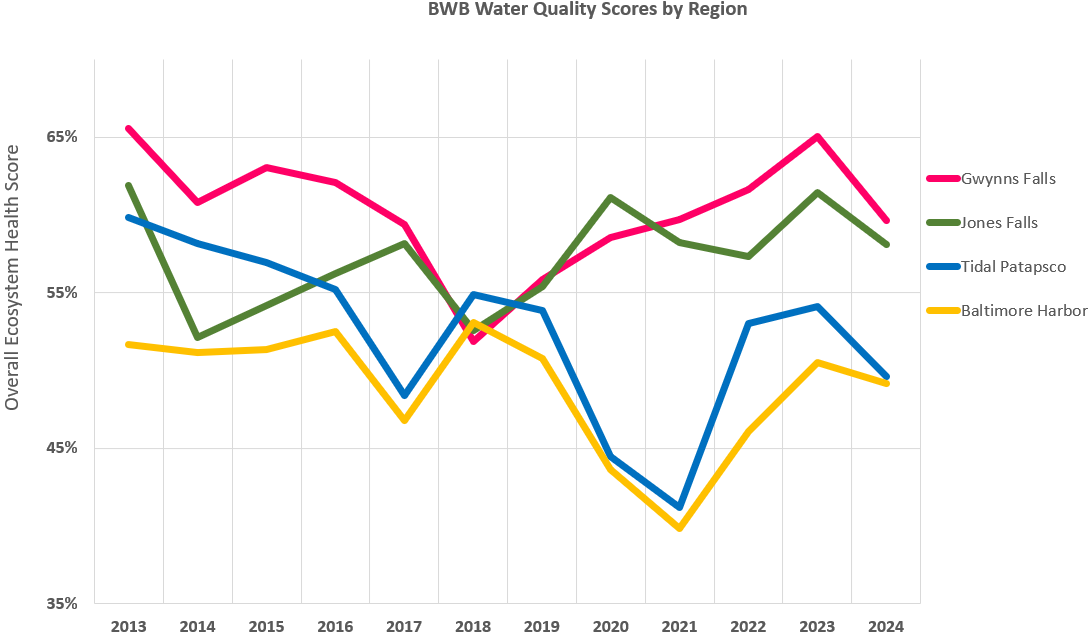
All of our eco-regions are showing slight declines in overall ecological health since 2023, but it’s the long-term trends that give us an indication of where we’re headed. The overall EcoScores in the Baltimore Harbor, Patapsco River, and Gwynns Falls regions are showing a weak declining trend from 2013 – 2024. The Jones Falls region is showing a weak improving trend. As always, the real story is in the data behind the scores.
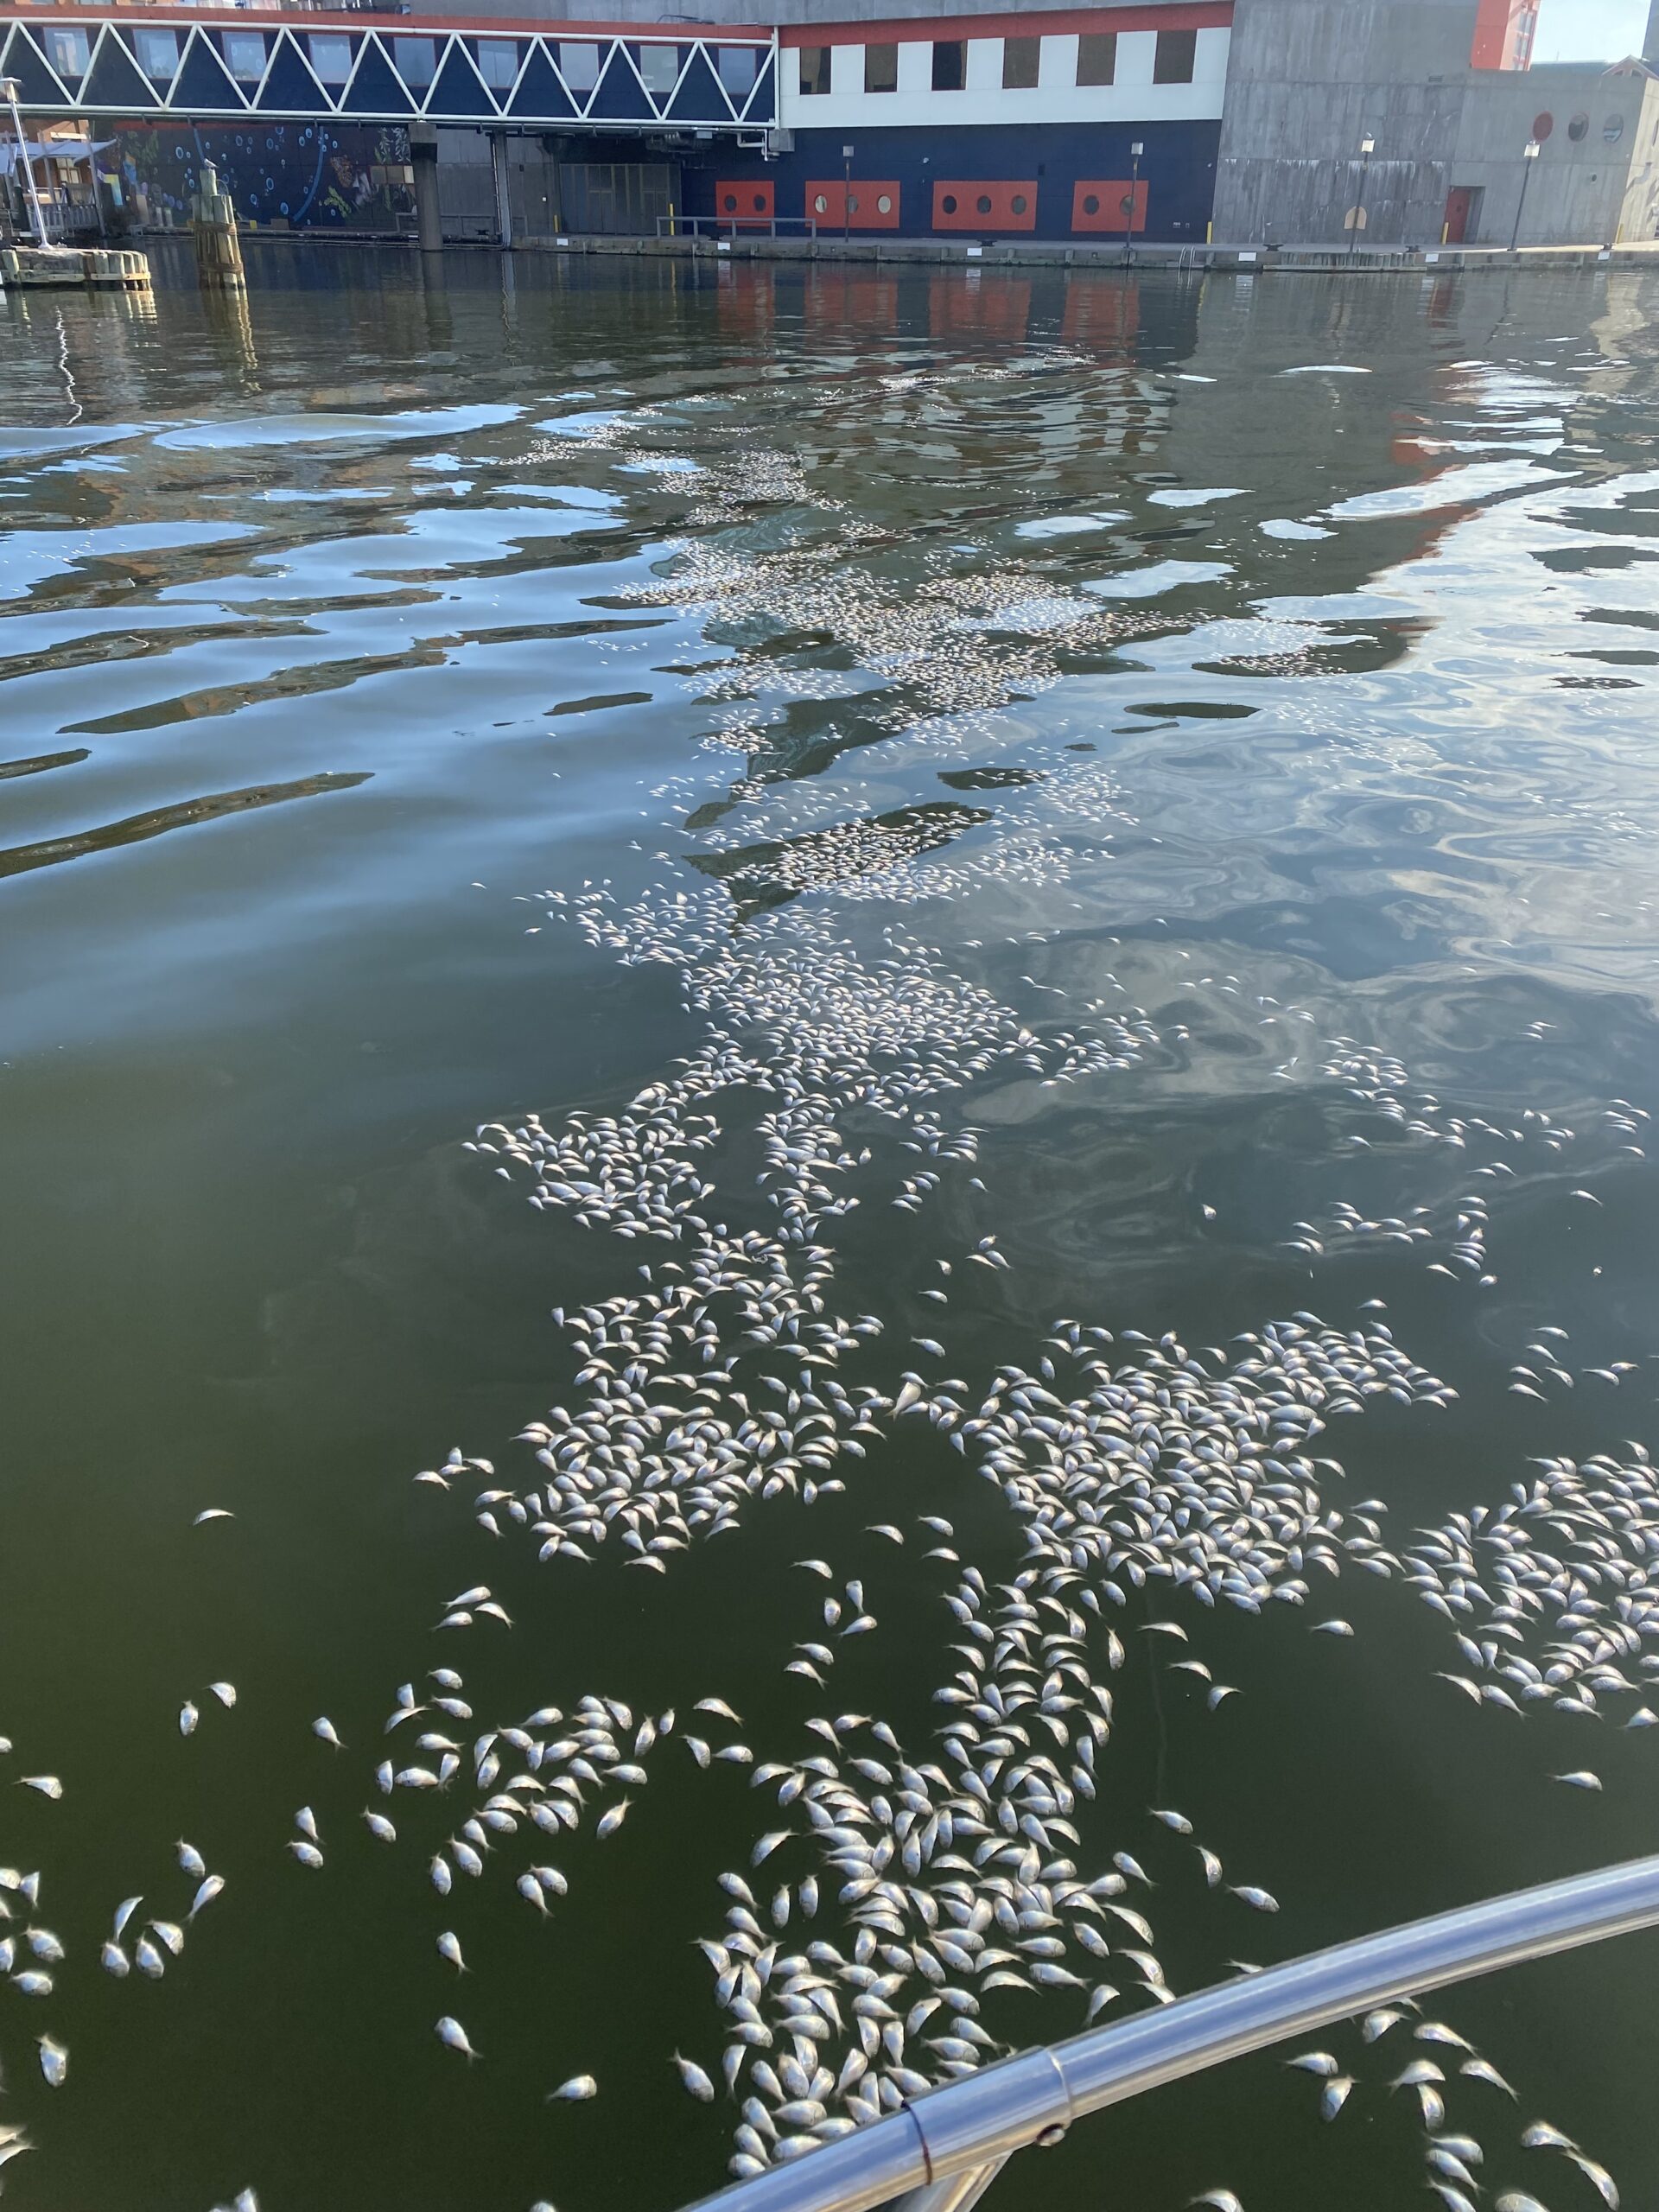
When we look at the individual parameter scores for key indicators of water health, we can see what’s buoying the EcoScores – and what’s dragging them down. In the Tidal Patapsco, dissolved oxygen levels vary from station to station but the average score is 93% – which is very good. We usually see a handful of hypoxic (low oxygen) or anoxic (no oxygen) readings at our Baltimore Harbor stations, and 2024 was no exception. These typically signify eutrophication following decaying algae blooms and occasionally precede or coincide with fish kills; for example, in September 2024 we documented thousands of dead Atlantic Menhaden in the Harbor, along with very low dissolved oxygen levels. But these events are episodic in nature, and for the majority of the sampling season the dissolved oxygen content in the water is actually quite good.
Unfortunately, chlorophyll levels were generally very poor in our tidal waterways in 2024, which led to an overall score of just 18% for that parameter. Chlorophyll levels are an indication of various types of algae in the water. Algae is an important part of ecosystem health because it is food for fish and other organisms in the water; but too much algae can ultimately lead to fish kills, and it can be toxic to people and wildlife.
Another parameter—conductivity—is like a big “humanity was here” stamp on our waterways, because it indicates that a stream has been damaged by a multitude of anthropogenic sources that were washed into our waterways every time it rains. Once again, the conductivity levels in our streams vary at each station across the watershed, but the average score was only 9%. These two parameters – chlorophyll and conductivity – are the lowest-scoring metrics of water health, and the long-term data trends are telling us that these problems are getting worse over time. The other major indicator of water health that is progressively getting worse over time is Total Phosphorus, in both our streams and our rivers.
But it’s not all bad news! Along with the consistently improving dissolved oxygen scores noted above, we are also seeing long-term improvements in Total Nitrogen and Water Clarity in both our tidal and non-tidal waterways. This is encouraging news, and it means there is hope for healthier streams and rivers in Baltimore.
What About Bacteria?
Rain drives waterway health in our region, because it washes land-based pollutants into our streams and rivers. Billions of dollars have been spent by public and private entities across the watershed to effectively de-couple surface water quality from rainfall events by replacing & relining pipe infrastructure, and installing more green stormwater infrastructure to capture and treat rainfall. This “green and gray” approach has been in effect for decades. However, our current regulatory permits don’t do enough to curb the volume of stormwater that gushes through our streets and streams every time it rains, and we need more nature-based solutions that improve both water quality and quantity in order to meaningfully improve watershed health.
Decisions about urban waterway recreation are very personal and we try to provide as much high-quality information as possible to help people make the best choices for themselves and their families. Our most recent fecal bacteria results for all stations are available online at BaltimoreWaterWatch.org. Additional resources to understand where sewage overflows have recently occurred include Baltimore City’s Interactive Map of Sewage Overflows, and Modified Consent Decree quarterly reports that detail sewage discharges flowing into waterways through the stormwater pipes, even in dry weather.
Where Do We Go From Here?
The federal Clean Water Act, passed in 1972, sets the bar high for our local waterways. Our streams should be fishable and swimmable, capable of sustaining thriving natural ecosystems for generations to come. Instead of focusing on just one metric, we measure a wide range of water health parameters to ensure we track our progress towards attaining that goal set more than fifty years ago. The path forward is clear. In order to improve overall ecosystem health scores, we must:
- Double down on our green stormwater infrastructure investments and make it easier to voluntarily install projects to create a greener, spongier urban ecosystem;
- Adequately fund sewer infrastructure projects and the maintenance costs to keep our systems in good working order;
- Continue tracking water health through our robust long-term water quality monitoring program, and;
- Pass legislation that eliminates trash pollution at the source, gives community members the means to hold polluters accountable, and strengthens laws for clean water.
Blue Water Baltimore is building a clean-water movement in the Baltimore region. Our data is the scientific backbone of the restoration, advocacy, engagement, and enforcement work we conduct throughout the year. To access our full dataset from 2024 and to see our most up-to-date readings, visit BaltimoreWaterWatch.org.