2023 marked our eleventh season of data collection and analysis in the waterways flowing throughout the Baltimore region.
Our water quality scores are calculated according to the Mid-Atlantic Tributary Assessment Coalition protocol, and each station is scored from 0-100% on the following factors: chlorophyll, conductivity, dissolved oxygen, water clarity, and total nitrogen and phosphorus. The higher the score, the healthier the waterway.
We also collect readings for “Vital Indicators” of water health including pH, temperature, and fecal bacteria. While these metrics are critical for ecological and public health, they are not included in the overall score. The underlying data is always available for free to the public at BaltimoreWaterWatch.org.
Use the toggle bar at the bottom of the map to scroll through parameters.
Note: Two of our Inner Harbor stations, at the MD Science Center and the World Trade
Center, are not included in the interactive map. View the PDF for those results.
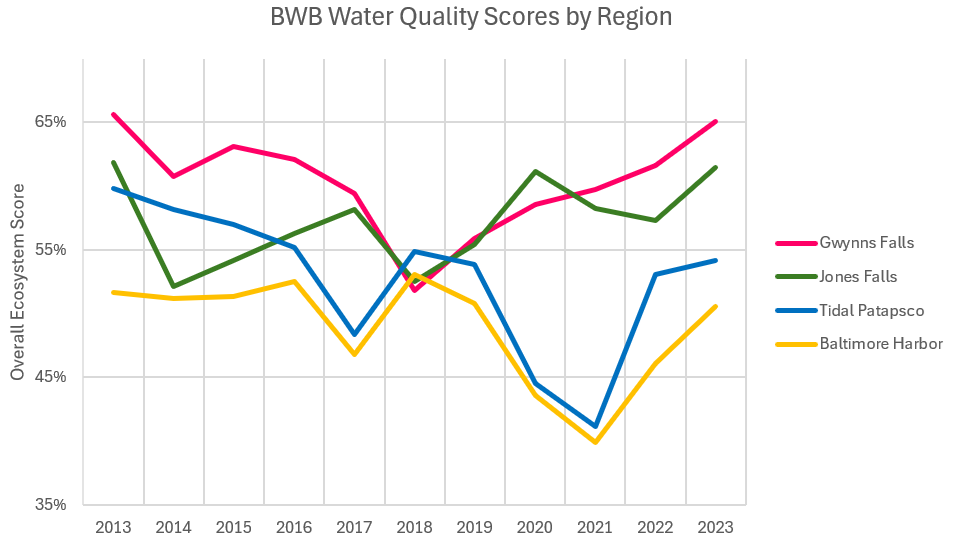
All of our eco-regions have shown improvement since 2022. In fact, 25 of our 27 stream stations scored better overall in 2023 than in 2022, and 17 of our 23 riverine stations showed improvement. However, the overall ecological health in the Baltimore Harbor, Patapsco River, and Gwynns Falls regions are showing a weak declining trend over the past eleven years. The Jones Falls region is showing a weak improving trend.
Rain drives waterway health in our region because it washes land-based pollutants into our streams and rivers. For example, nitrogen and phosphorus are nutrients that are critical to ecosystem health, but sewage overflows, uncontrolled stormwater runoff, malfunctioning wastewater treatment plants, and other problems on land can contribute excessive nutrients to our waterways which ultimately leads to algae blooms and fish kills.
Another parameter—conductivity—is like a big “humanity was here” stamp on our waterways, because it indicates that a stream has been damaged by a multitude of anthropogenic sources. Our current regulatory permits don’t do enough to curb the volume of stormwater that gushes through our streets and streams every time it rains, and we need more nature-based solutions that improve both water quality and quantity in order to meaningfully improve watershed health.
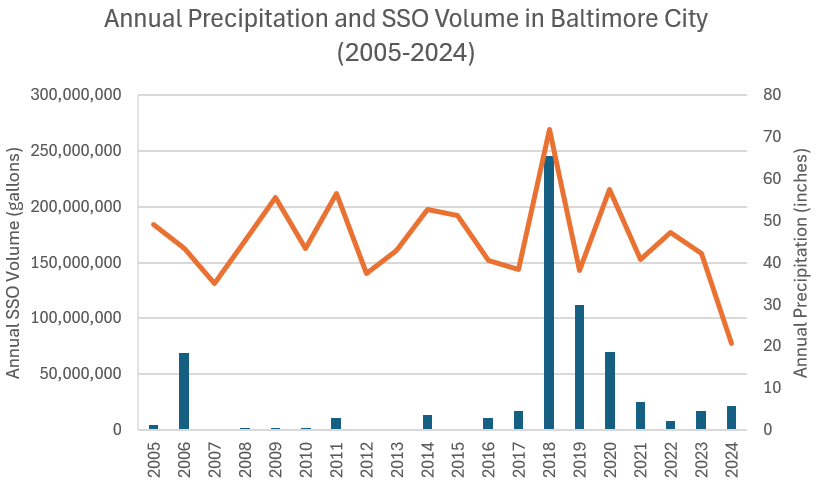
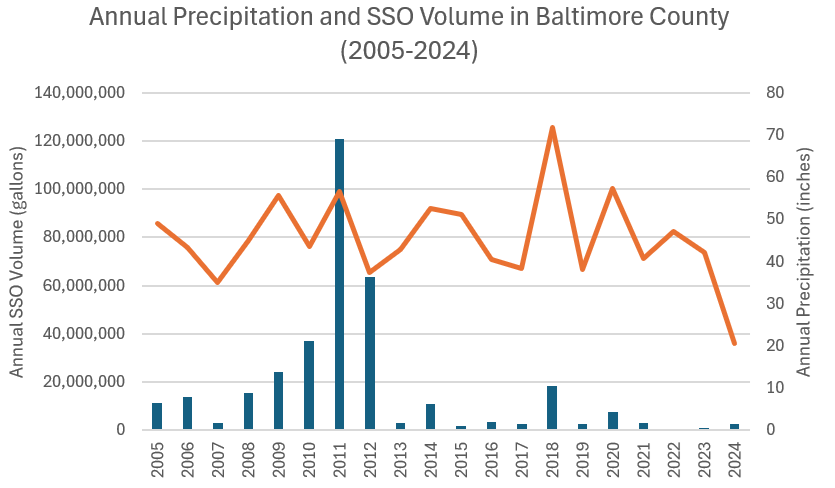
One of the main sources of pollution that Blue Water Baltimore advocates around is sanitary sewage overflows entering our waterways from the municipally-owned collection systems in Baltimore City and Baltimore County. Since 2015, we have also been working hard to advocate for a better response to sewage backups, which are extremely dangerous and harmful to human health. The graphs at right show annual precipitation at BWI airport correlated with the annual volume of sewage overflows reported by Baltimore City and Baltimore County. While Baltimore has made significant progress towards installing the capital projects needed to cease these overflows, it is clear that there is still much work to be done to clean up our waterways and protect public health.
For example, several “structured overflow” points along the collection system that routinely discharge millions of gallons of sewage into the Jones Falls and Gwynns Falls stream each year are still wide open. The federally-mandated deadline for closing these pipes has come and gone, and the latest estimate for their elimination is not until 2027 at the earliest. This is because the main interceptor pipe that carries sewage to the Back River Wastewater Treatment Plant is caked with sewage debris like un-flushable wipes, and needs to be scraped clean before it can properly convey sewage at full capacity.
At the time of this report, annual precipitation and sewage overflow data for 2024 in these graphs is current through June 2024. And yet, even though we are just halfway through the year with roughly 20 inches of rain, reported sanitary sewer overflows have increased in both Baltimore City and Baltimore County since 2023 (at 40 inches of rain). This continues the trend from 2022.
Decisions about urban waterway recreation are very personal and we try to provide as much high-quality information as possible to help people make the best choices for themselves and their families. Our most recent fecal bacteria results for all stations are available online at BaltimoreWaterWatch.org. Additional resources to understand where sewage overflows have recently occurred include Baltimore City’s Interactive Map of Sewage Overflows, and Modified Consent Decree quarterly reports that detail sewage discharges flowing into waterways through the stormwater pipes.
The federal Clean Water Act, passed in 1972, sets the bar high for our local waterways. Our streams should be fishable and swimmable, capable of sustaining thriving natural ecosystems for generations to come. Instead of focusing on just one metric, we measure a wide range of water health parameters to ensure we track our progress towards attaining that goal set more than fifty years ago. The path forward is clear. In order to improve overall ecosystem health scores, we must:
- Double down on our green stormwater infrastructure investments and make it easier to voluntarily install projects to create a greener, spongier urban ecosystem;
- Adequately fund sewer infrastructure projects and the maintenance costs to keep our systems in good working order;
- Continue tracking water health through our robust long-term water quality monitoring program, and;
- Pass legislation that eliminates trash pollution at the source, gives community members the means to hold polluters accountable, and strengthens laws for clean water.
Blue Water Baltimore is building a clean-water movement in the Baltimore region. Our data is the scientific backbone of the restoration, advocacy, engagement, and enforcement work we conduct throughout the year. To access our full dataset from 2023 and to see our most up-to-date readings, visit BaltimoreWaterWatch.org.