Baltimore Water Watch: Presenting Our 2018 Water Quality Scores
How’s the Water, Hon?
Blue Water Baltimore is thrilled to announce the launch of our new water quality mapping platform: www.baltimorewaterwatch.org! We worked with the experts at Chesapeake Commons for our new innovative approach to data visualization. For the first time ever, we are able share in-depth information about the specific measurements of water health that drive the overall EcoScores at each of our tidal and non-tidal stations. Every indicator we track is equally important; from the Dissolved Oxygen content in the Inner Harbor to the Conductivity Levels in the Towson Run, each measurement has a story to tell about the ecology of our streams, rivers, and harbor – and the pollutants degrading them. On Baltimore Water Watch you will find the recent measurements on our Current Conditions map. You can also learn about the overall ecosystem health on the Report Card map. In addition to seeing the overall score for each station in 2018, our new maps displays results of each indicator.
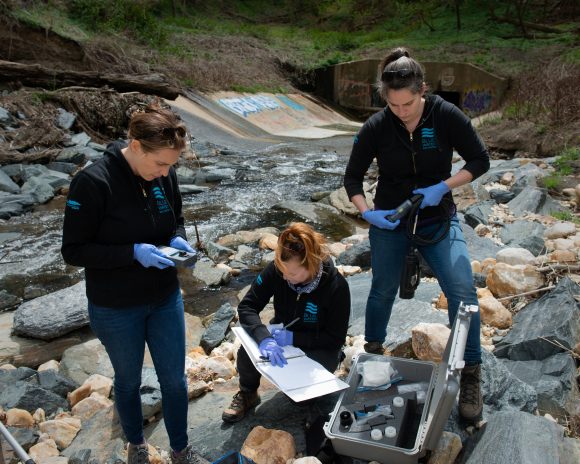
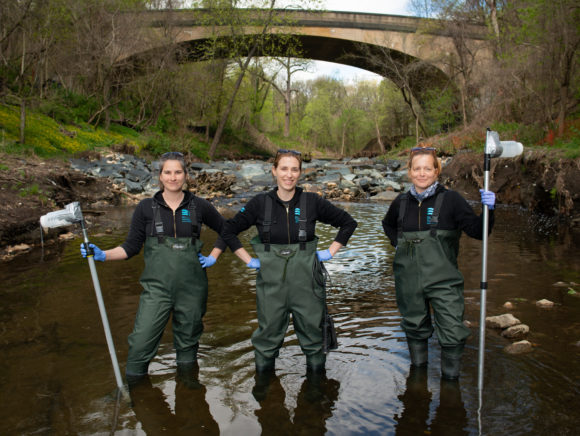
Our field staff and volunteers monitor 49 stations in the streams and rivers of the Baltimore region year round. We run the most rigorous non-traditional monitoring program in the entire Chesapeake Bay watershed.
After analyzing tens of thousands of data points in 2018, we are proud to share our water quality report card which shows overall scores of water health at each of our stations. Some of the biggest stories from 2018 are detailed below, and you can find out more by exploring Baltimore Water Watch and checking out our 2018 Report Card:
- 2018 was the wettest year on record for the Baltimore region with over 71 inches of rain – that’s 29 inches more than an average year! The excessive rainfall had some complex effects on water quality in our streams, rivers, and harbor; and you might be surprised by some of our results.
- Despite the fact that 2018 was the rainiest year on record, we continued to see improved bacteria scores in our non-tidal waterways. This is encouraging news because we now have two years of data showing improvements! While we can’t attribute these improvements to any specific cause, we know that Baltimore City and Baltimore County are working to repair and update their pipe infrastructures with a goal of reducing sewage overflows into our waterways. We look forward to 2019 when we can collect more data to see if this is really an upward trend.
- Turbidity and Phosphorus scores were significantly worse in the Gwynns Falls watershed in 2018 than ever before. This is most likely due to increased stormwater runoff from the heavy rains we received last year. Polluted stormwater runoff brings massive sediment loads into our waterways, and phosphorus tends to cling to those sediment particles. Other contaminants such as microplastics, pesticides, and Polychlorinated biphenyls (PCBs), can also cling to sediment and degrade our streams and harbor even further.
- Nutrients like Nitrogen and Phosphorus tend to feed algae blooms because they act like fertilizers for the microscopic plants that naturally live in our tidal waterways. Based on the increased Phosphorus in the Gwynns Falls, one might expect to see increased algae blooms in the receiving Baltimore Harbor and tidal Patapsco River. However, we saw dramatically improved chlorophyll levels throughout our tidal waterways in 2018, which is the parameter we use to detect the presence of algae in the water. We believe this is because the excessive amounts of rain had a flushing effect on our waterways, and the algae was essentially swept out to sea before it could grow into a bloom.
Another exciting new feature of Baltimore Water Watch is that users can directly download all six years of our water quality monitoring data from 2013 to 2018. Visit our new mapping platform to find out more about the health of our waterways, and to discover the stories our data are telling.
Download our summary 2018 Printed Report
See our in-depth 2018 Online Report
This work is only possible because of the support of our members.